Financial Highlights for Fiscal Year
Ended December 31, 2024 (FY 2024)
(In millions of yen; amounts rounded down to the nearest million yen)
| FY 2023 | FY 2024 | YoY change | |
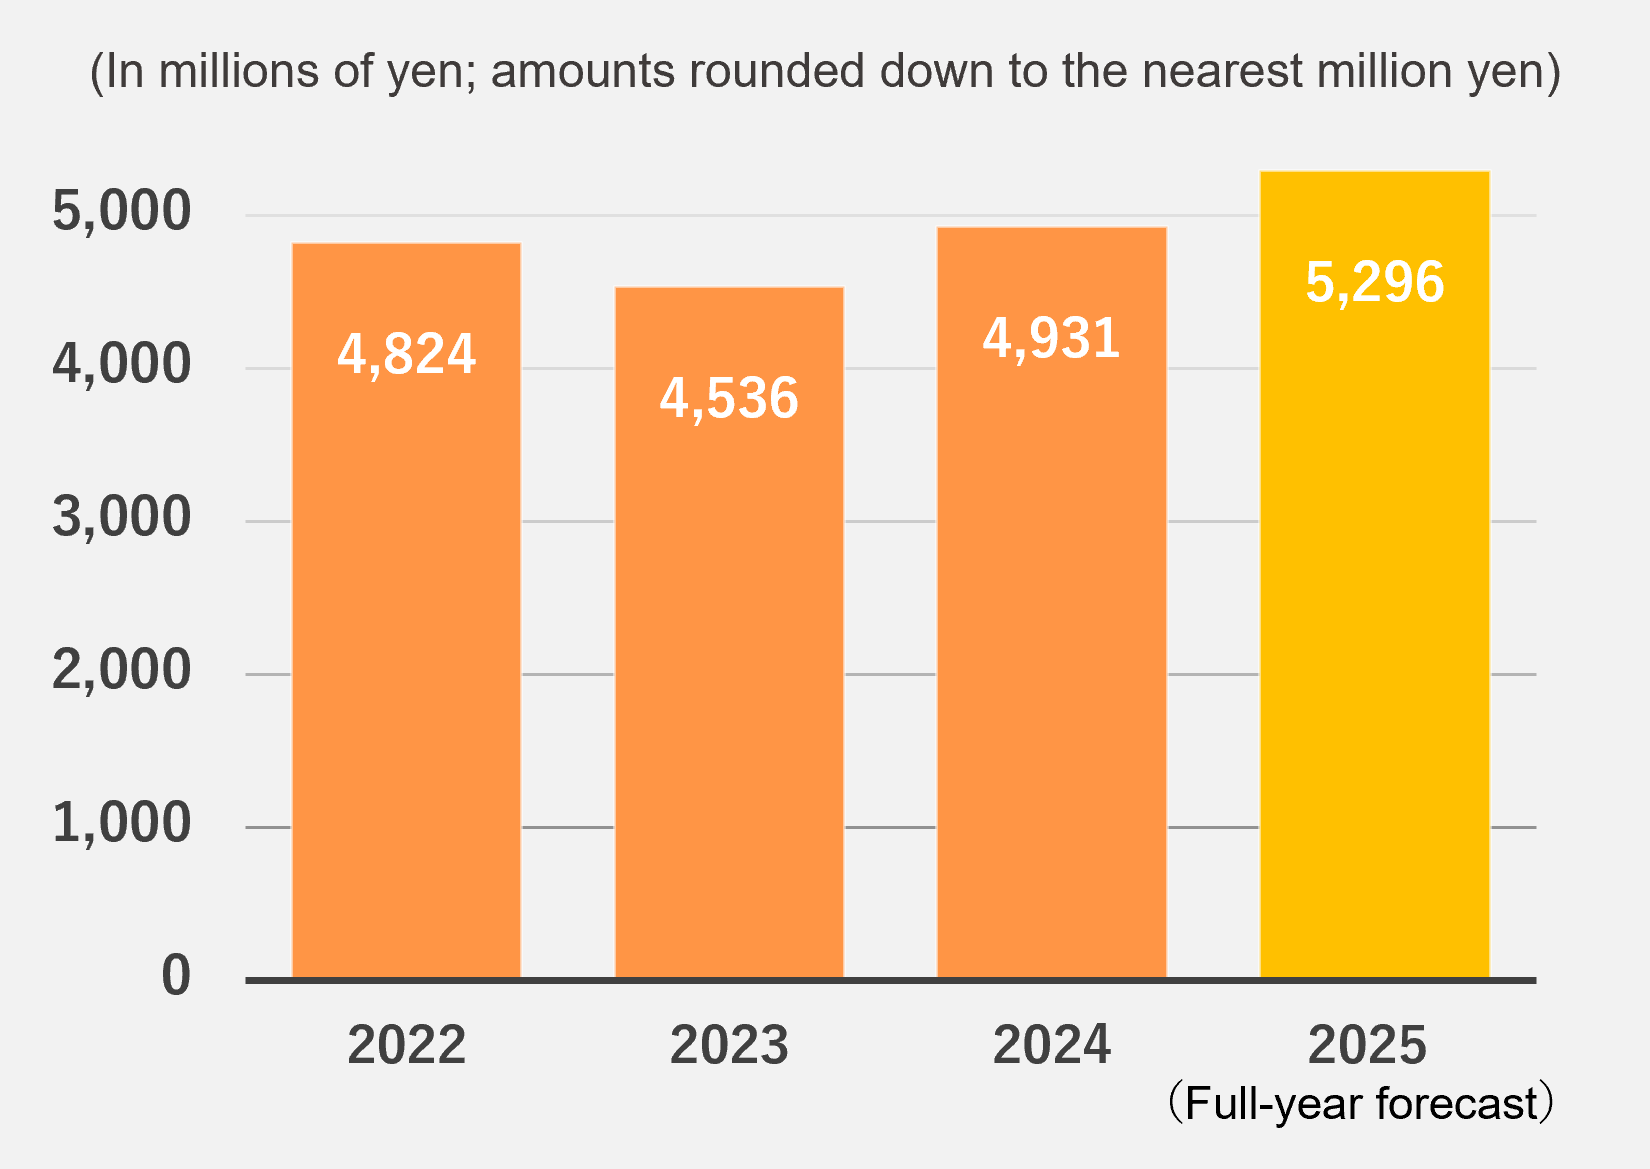
| Net sales | 4,536 | 4,931 | +394 (+8.7%) |
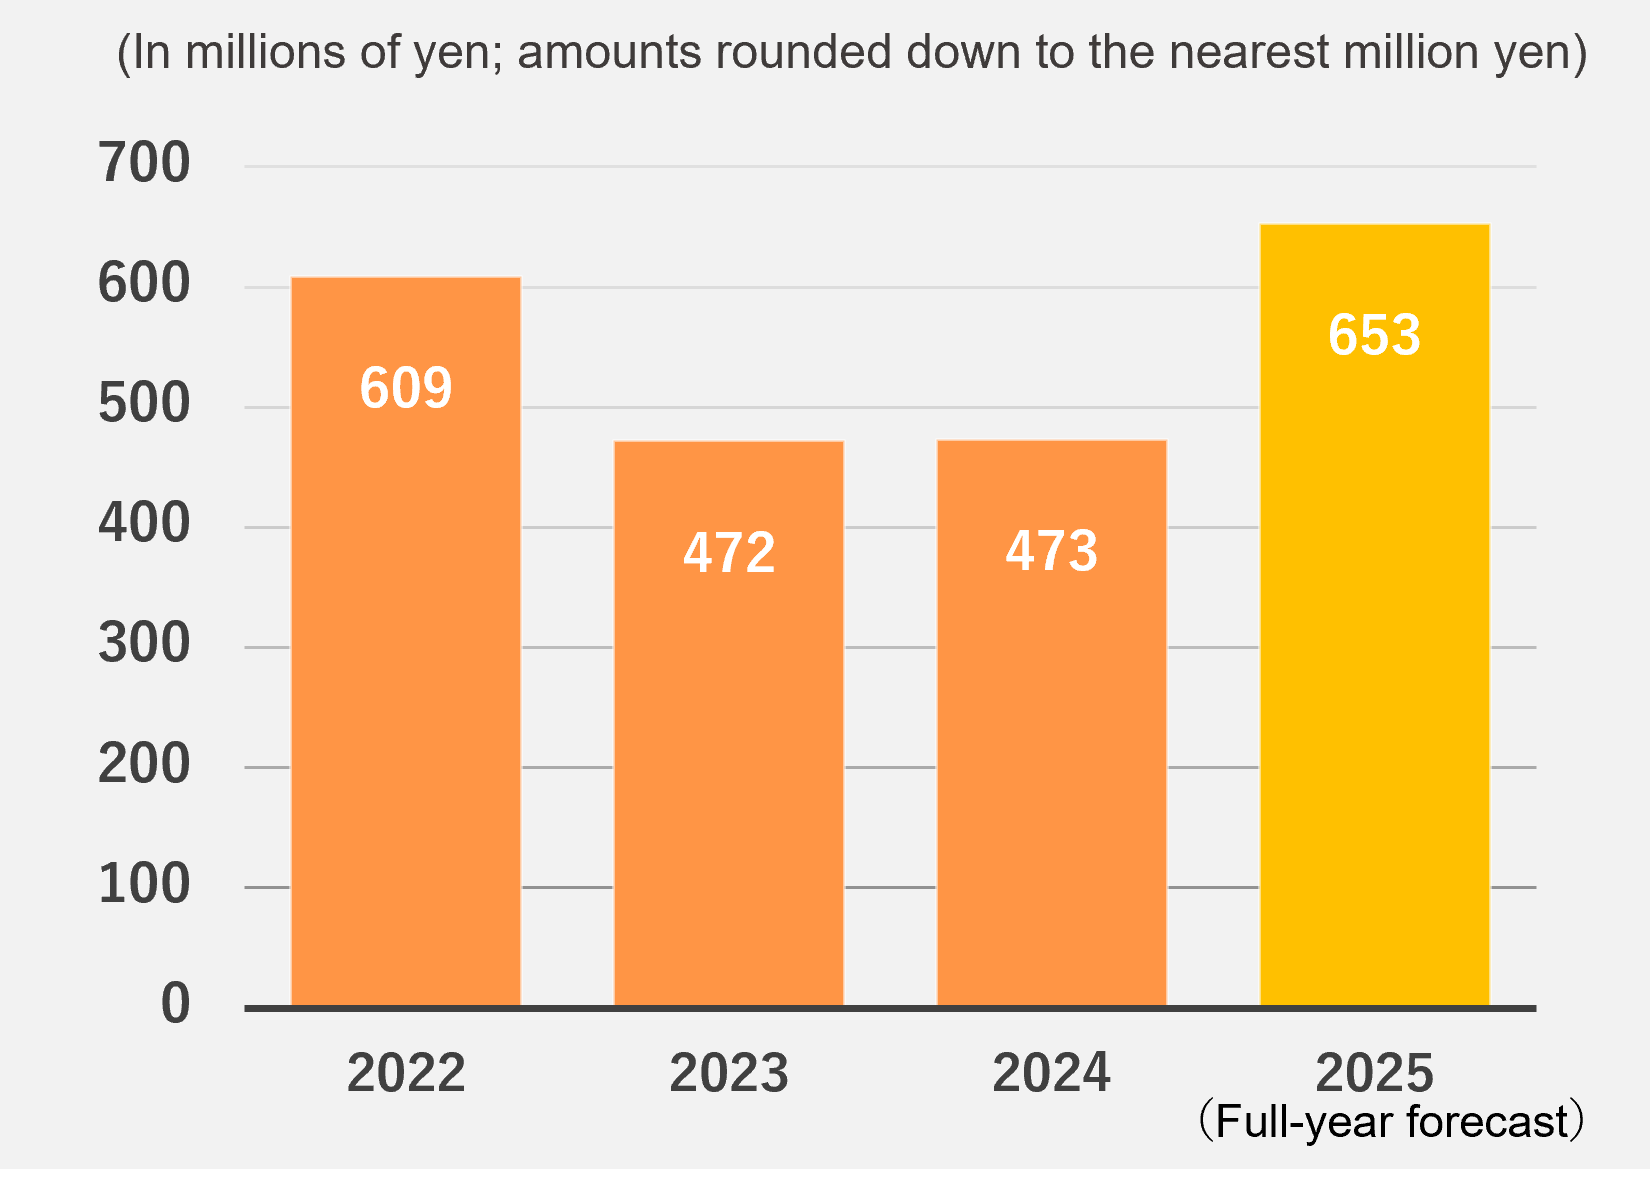
| Operating profit | 472 | 473 | +1 (+0.3%) |
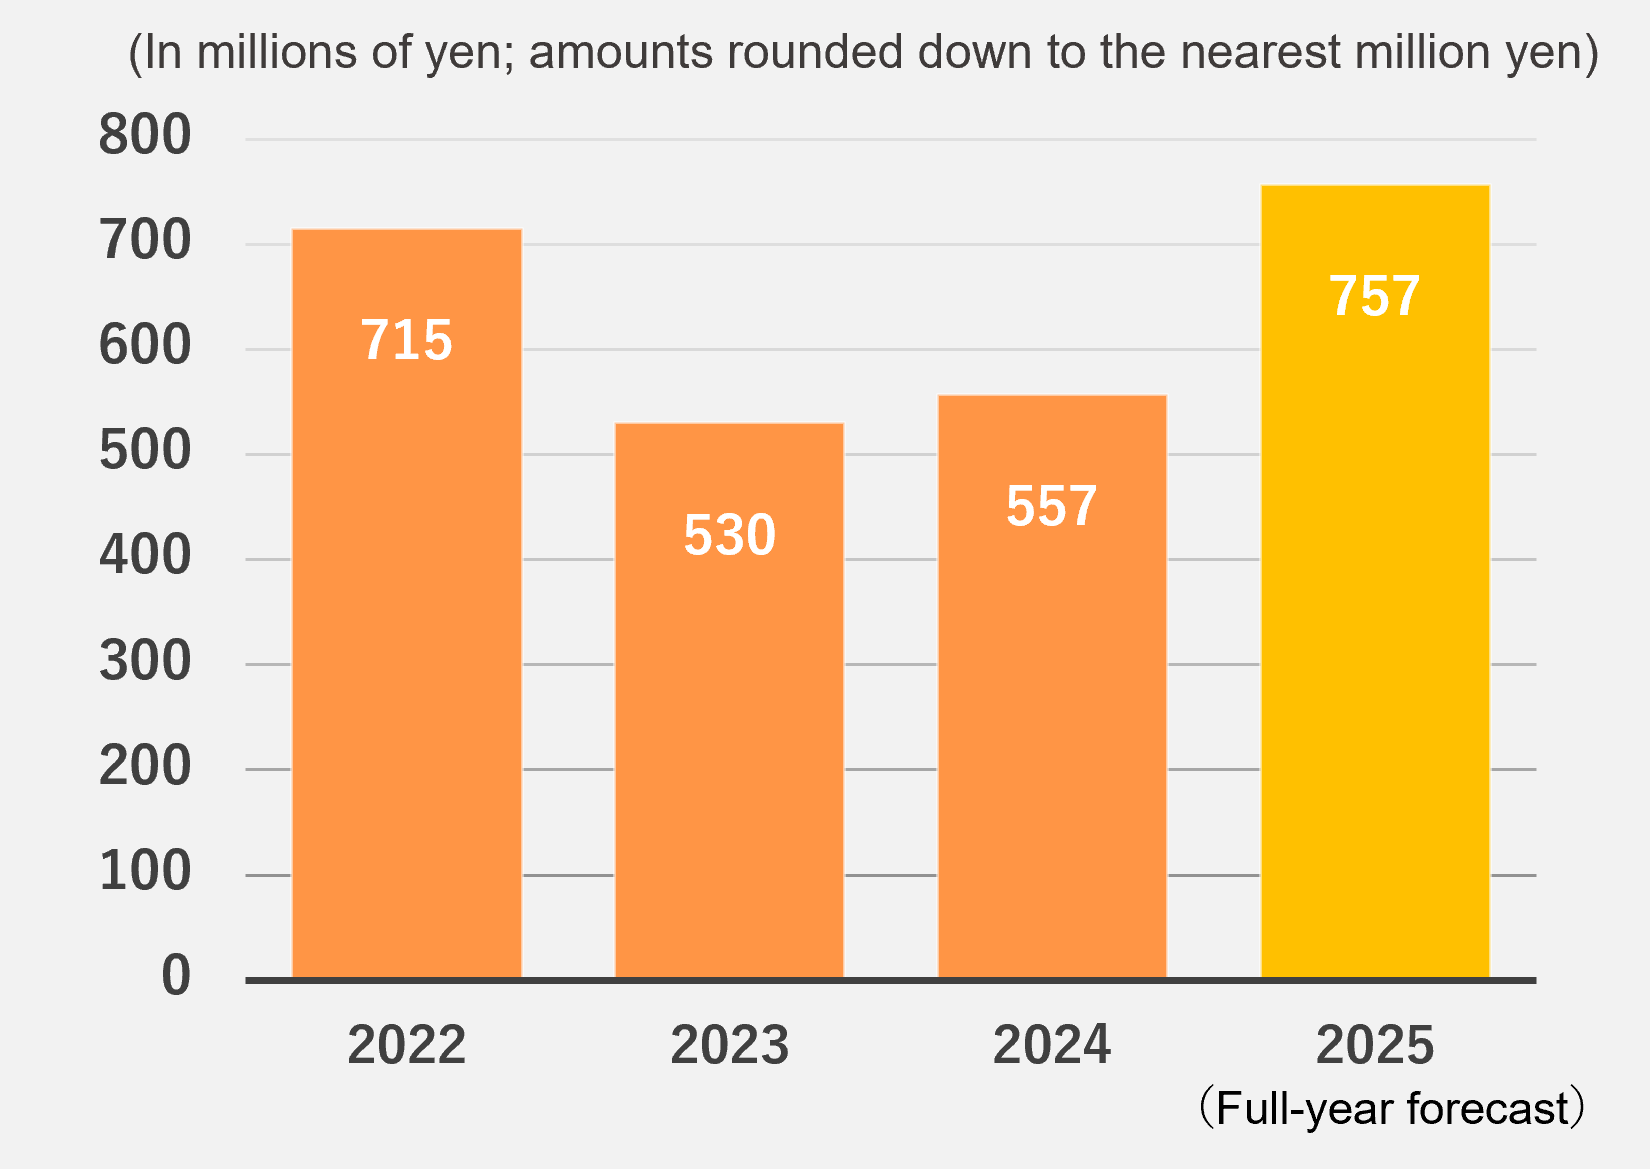
| Ordinary profit | 530 | 557 | +27 (+5.1%) |
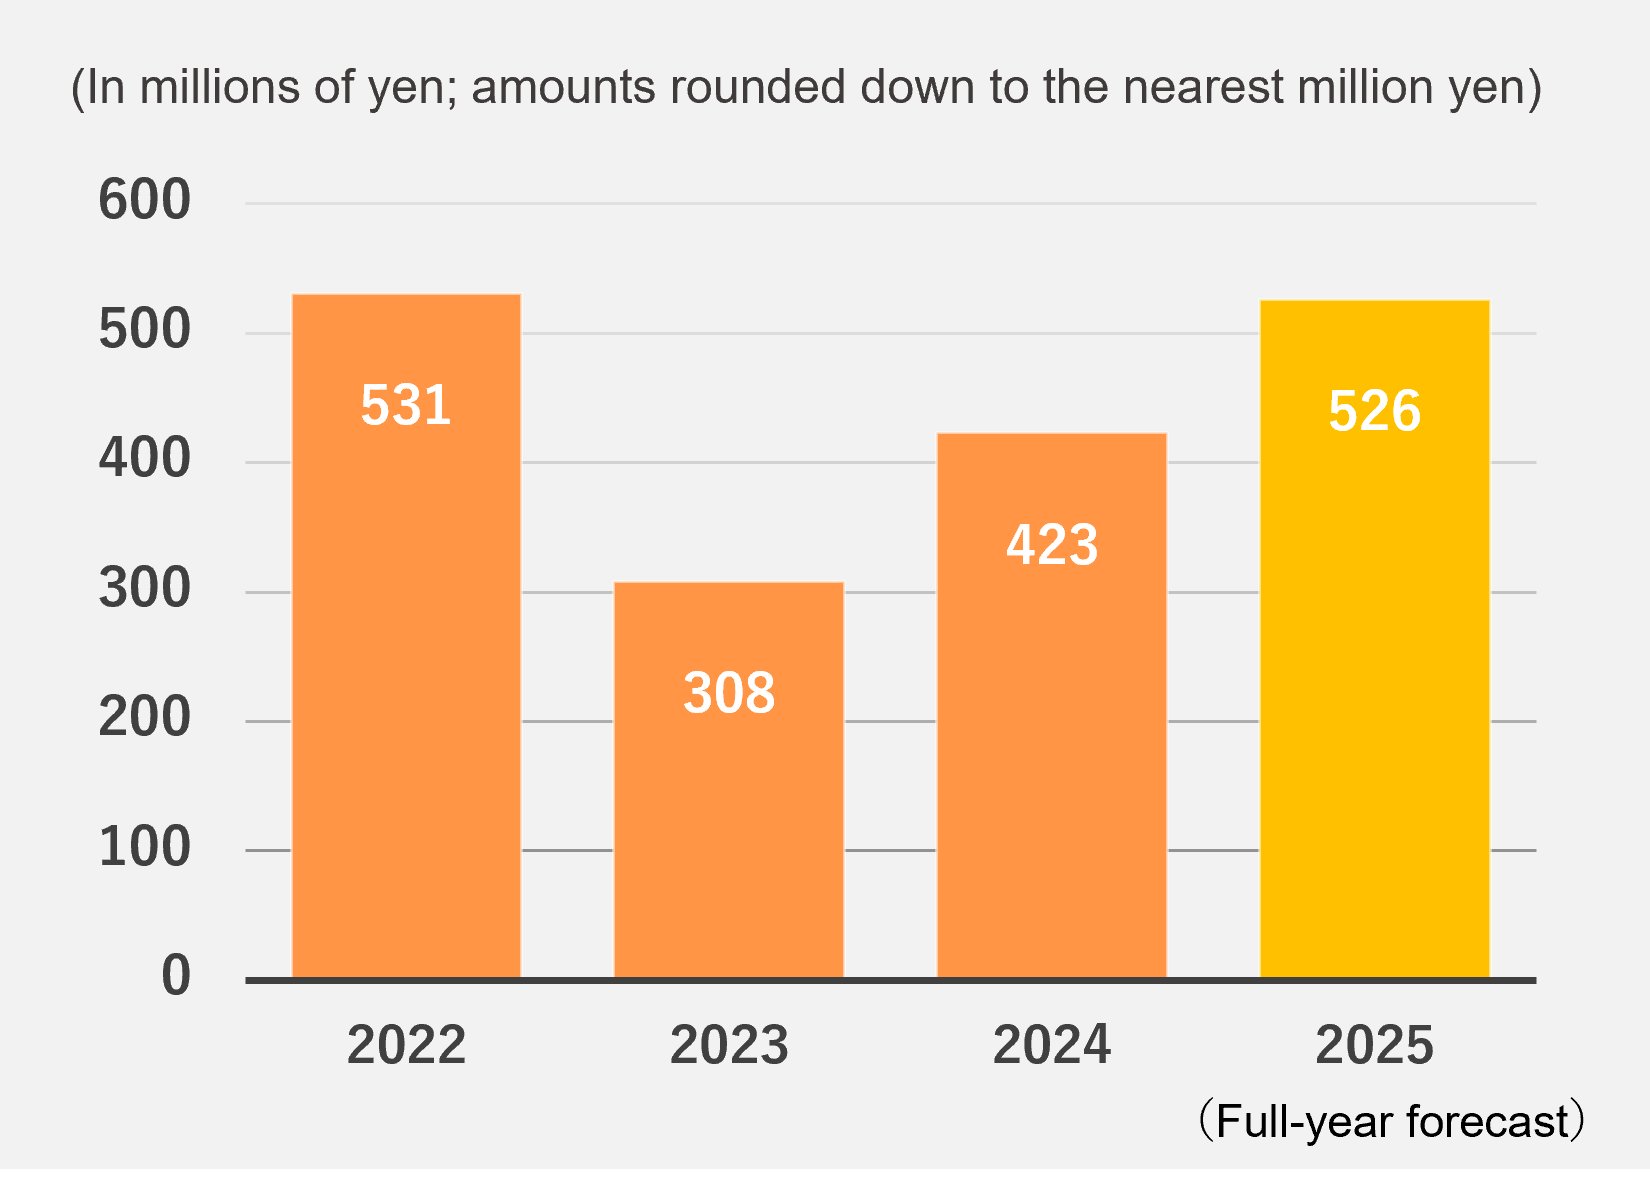
| Profit attributable to owners of parent | 308 | 423 | +114 (+37.2%) |
Cyano Project integrated support services】
Against the background of the emergence of governance risks caused by shortages of human resources and issues of knowledge transfer at client companies, our Sustainable BPO services, which use ICT and BPO to support circular corporate management, are performing steadily. At Circular LinX CO., LTD., a joint venture between the Company and the Sumitomo Mitsui Finance and Leasing Group established on April 1, 2024, we are offering ICT and BPO services aimed at enhancing business efficiency and improving service quality, and are already seeing the emergence of effects linked to sales, such as a year-on-year increase in inquiries for services since April 2024.
In the Double Zero Emission Service, which promotes the shift to zero incineration, zero landfill, and zero GHG emissions through closed-loop resource recycling of industrial waste, demand for circulating resources remains strong. We saw increased volumes in substitute fuels for cement and launched new recycling facilities at the Kitakyushu Resource Recycling Plant. These new facilities, along with automation and reduced labor at existing plants, have led to an upward trend in volume handled compared to the previous fiscal year.
With regard to closed-loop resource recycling of industrial waste in Malaysia, there is strong demand for circulating resources locally and volume handled is exceeding previous-fiscal year levels. We are strengthening sales in order to win further new projects as they appear. Based on the memorandum of understanding for strategic business alliance that it concluded on September 2, 2024 with Cenergi SEA Berhad (Cenergi), which is engaged in the renewable energy business in Malaysia, the Company is moving forward with a commercial feasibility study on converting unused biomass materials in Malaysia into biofuels and developing a business model around them.
On September 2, 2024, ACD established a joint venture with PT Tamaris Prima Energi, which is part of the Tamaris-Moya Group, which is engaged in the renewable energy and public water supply businesses in Indonesia and is itself part of the Salim Group, one of the largest conglomerates in Southeast Asia. The joint venture, which is named PT Amita Tamaris Lestari ("ATL"), is tasked with developing decarbonized, circular business models. Moreover, on October 7, 2024, ATL established a joint venture PT Amita Prakarsa Hijau, which is engaged in the closed-loop resource recycling business locally with PT Sari Bhakti Sejati, a subsidiary of leading Indonesian cement manufacturer PT Indocement Tunggal Prakarsa Tbk. We are forging ahead with initiatives to lay the business foundation, aiming to open a resource recycling plant in Indonesia by the end of FY2027 in preparation for the full-fledged development of the closed-loop resource recycling business.
As measures related to the Ministry of the Environment's "City-to-City Collaboration Program to Support the Decarbonization Efforts by Overseas Subnational Governments" initiatives for decarbonization in India, Indonesia, and Palau, which were adopted on April 1, 2024, we are conducting investigations, etc. in preparation for the commercialization of waste resource recycling in each country. Based on an agreement (concluded on May 1, 2024) with Ramky Group, a leading player in the Indian environmental industry and our partner for feasibility studies, to jointly conduct a comprehensive feasibility study on developing decarbonized societies and circular economies with a focus on India and other developing countries, as well as Singapore.
Co-Creation City】
In December 2024, we introduced two MEGURU STATION® locations in Buzen, Fukuoka Prefecture, the first in the city. We're advancing sustainable community development initiatives in Buzen, including a points system implementation with NEC Solution Innovators, Ltd. and Tsunaken Regional Connection & Development Organization for regional revitalization.
Elsewhere, based on the Kameoka Future Creation Environmental Partnership Agreement concluded with Kameoka, Kyoto Prefecture (September 9, 2024), we are working together on sustainable community development through a resource circulation ecosystem.
In terms of the initiatives related to construction of the MEGURU PLATFORM*2, we have continued building a circular model for plastics centered on MEGURU STATION®, as part of the Cabinet Office's Cross-ministerial Strategic Innovation Program (SIP), since July 2023.
*1 : MEGURU COMPLEX
MEGURU COMPLEX is a resource circulation solution for municipalities that embodies the Co-Creation City concept. By clustering a biogas power plant for flammable waste recycling together with facilities for recycling diapers and for pyrolysis, we aim to reduce waste incineration and landfill to zero.
*2 : MEGURU PLATFORM
MEGURU PLATFORM consists of MEGURU STATION® community-type resource collection station, and MEGURU FACTORIES, where quality resources and information are gathered and the collected traceable resources are turned into circular materials. In preparation for realizing the AMITA Vision 2030, we are working to build a framework to generate the optimal circulation of tangibles, information, and people's thoughtfulness.
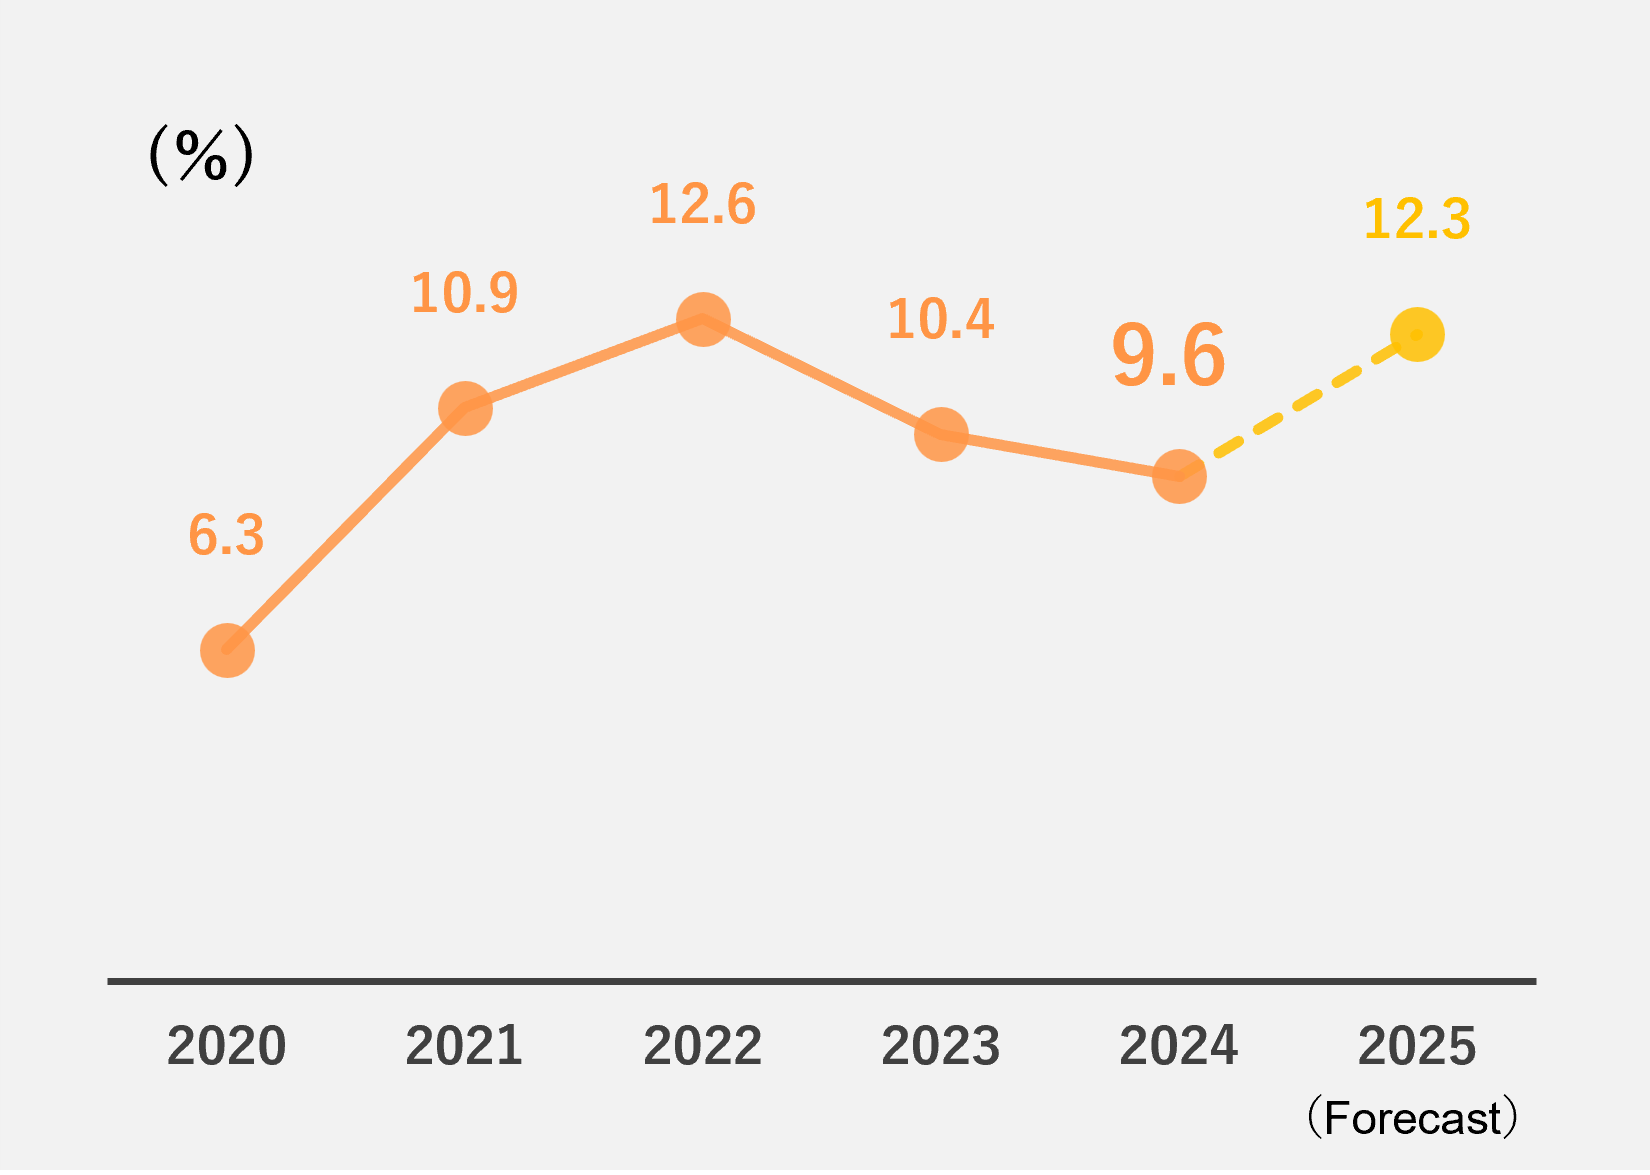
■Operating Profit Margin
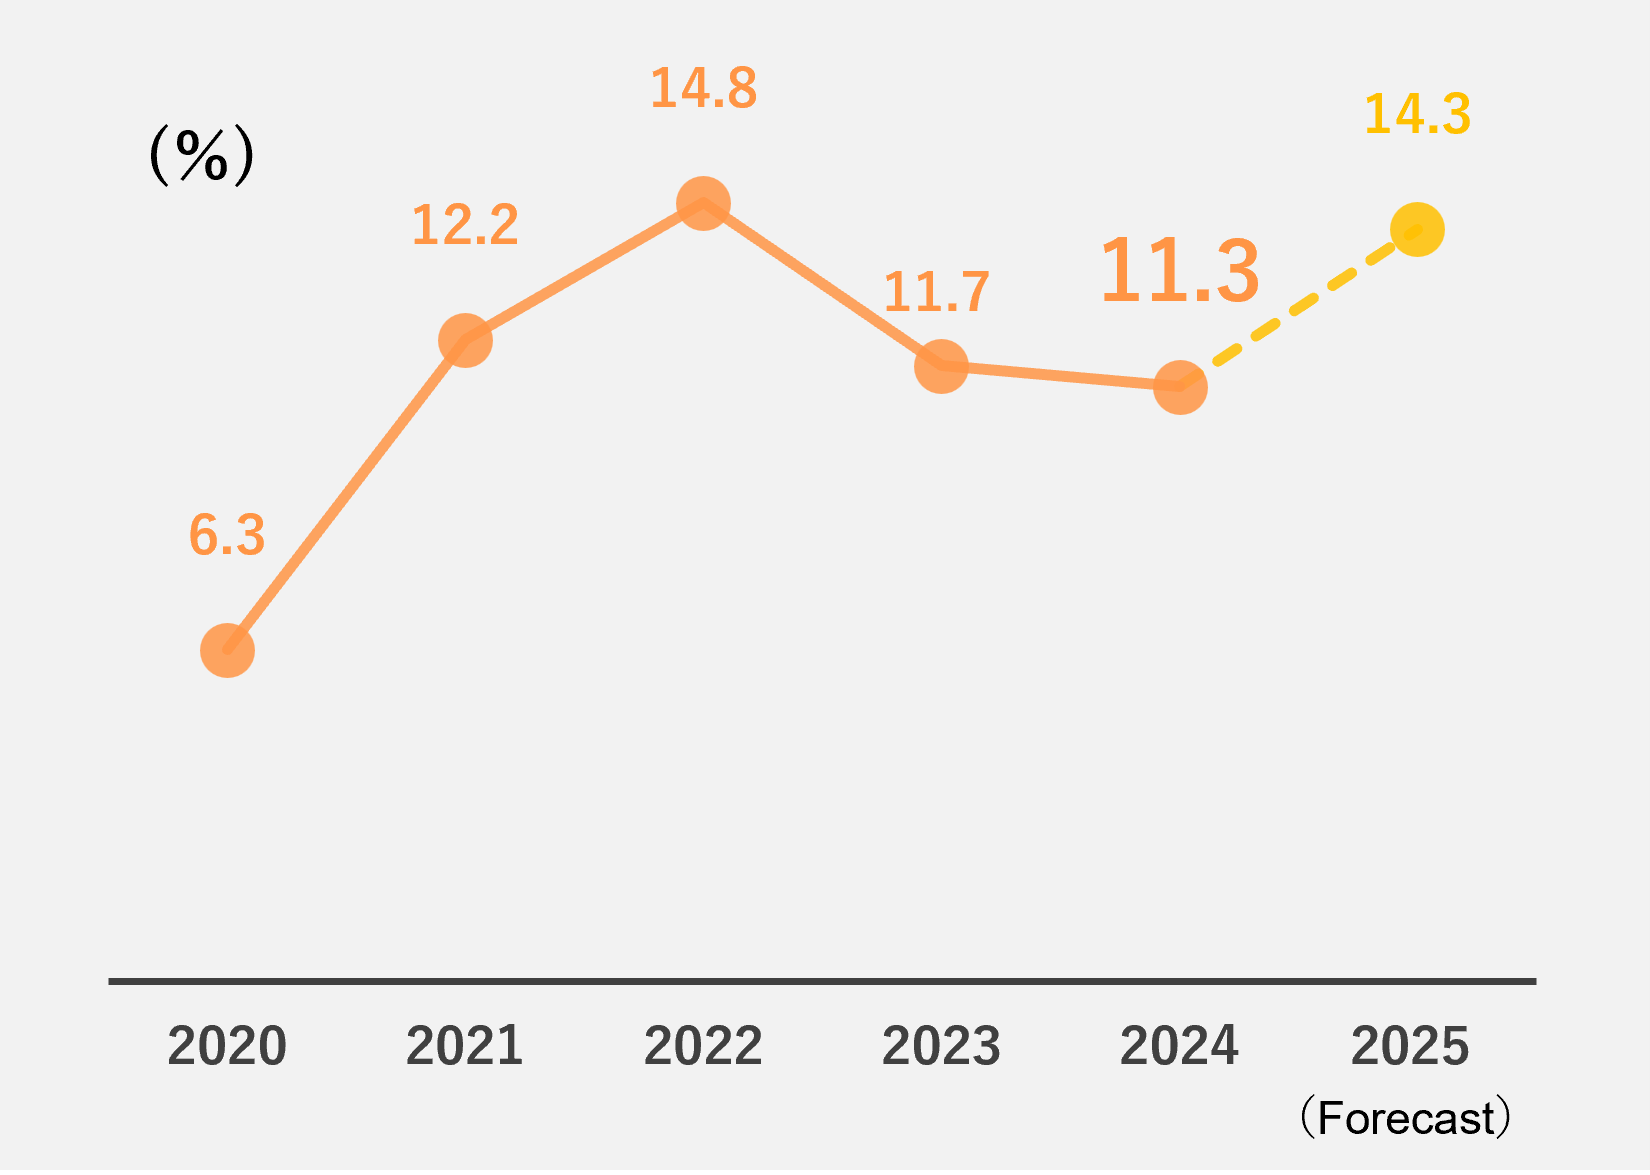
■Ordinary Profit Margin
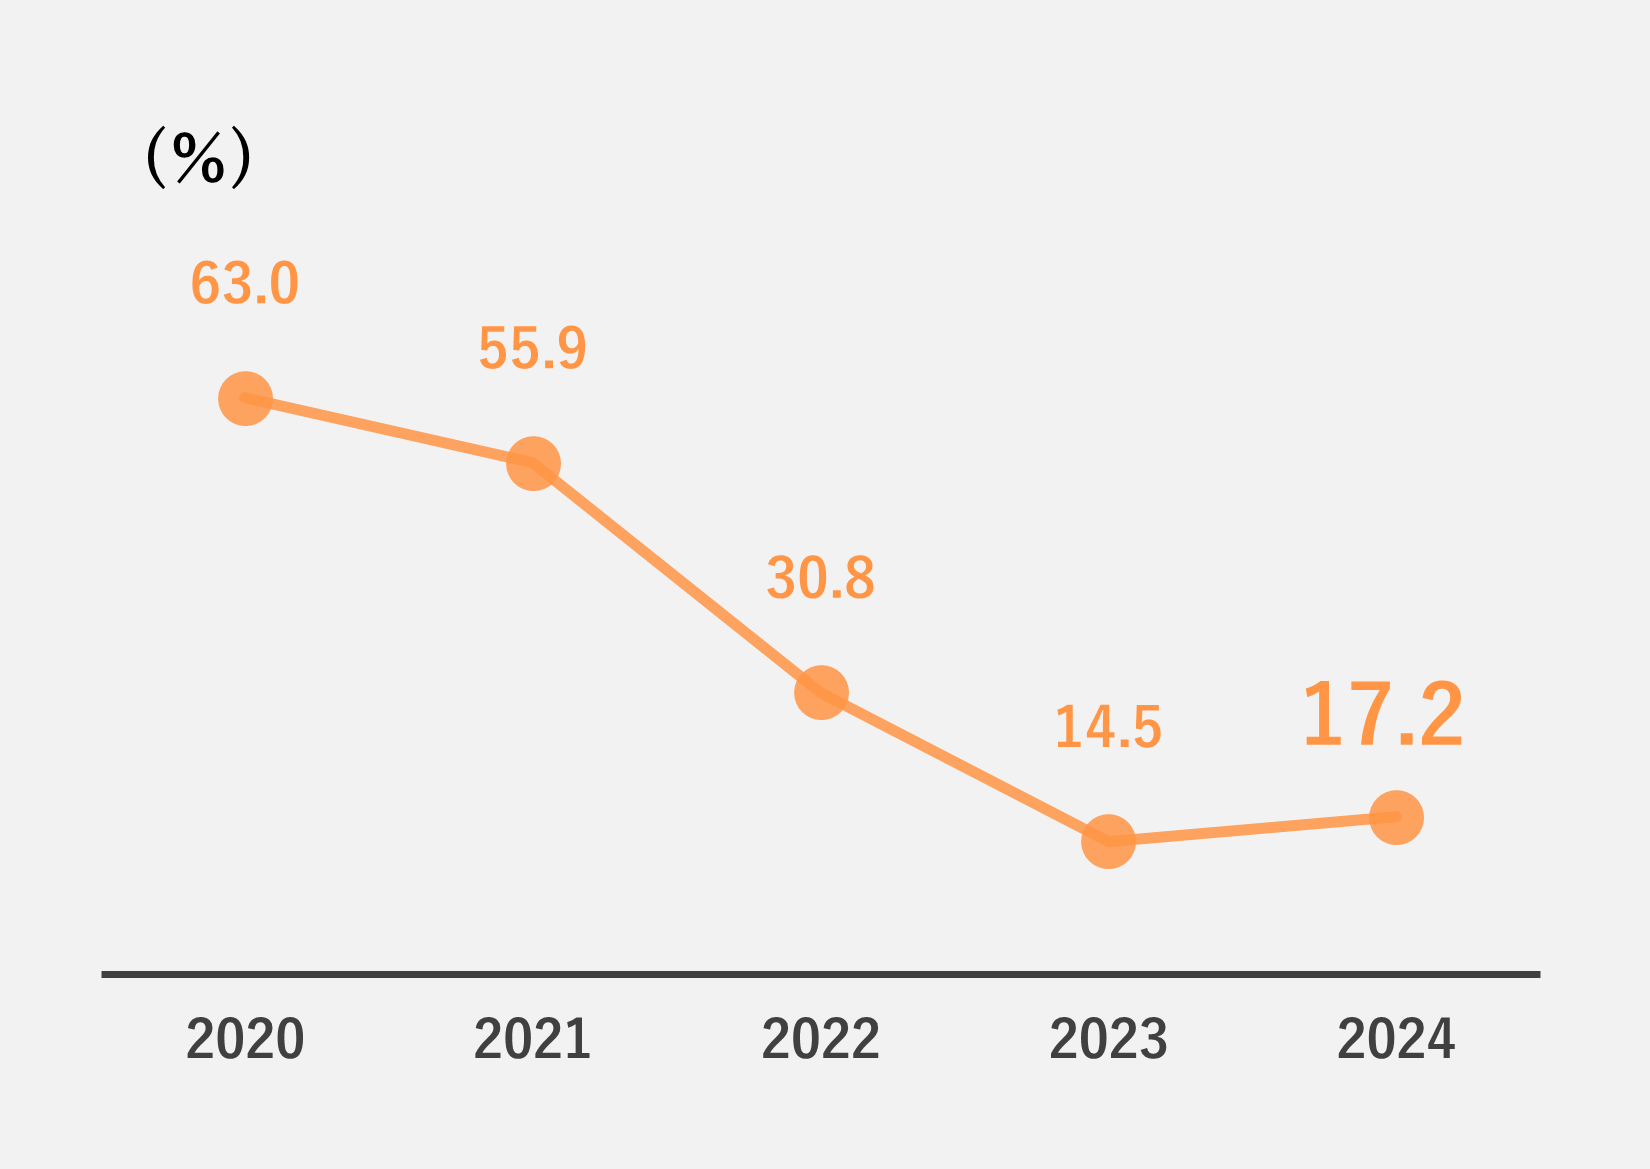
■ROE(Return on Equity)
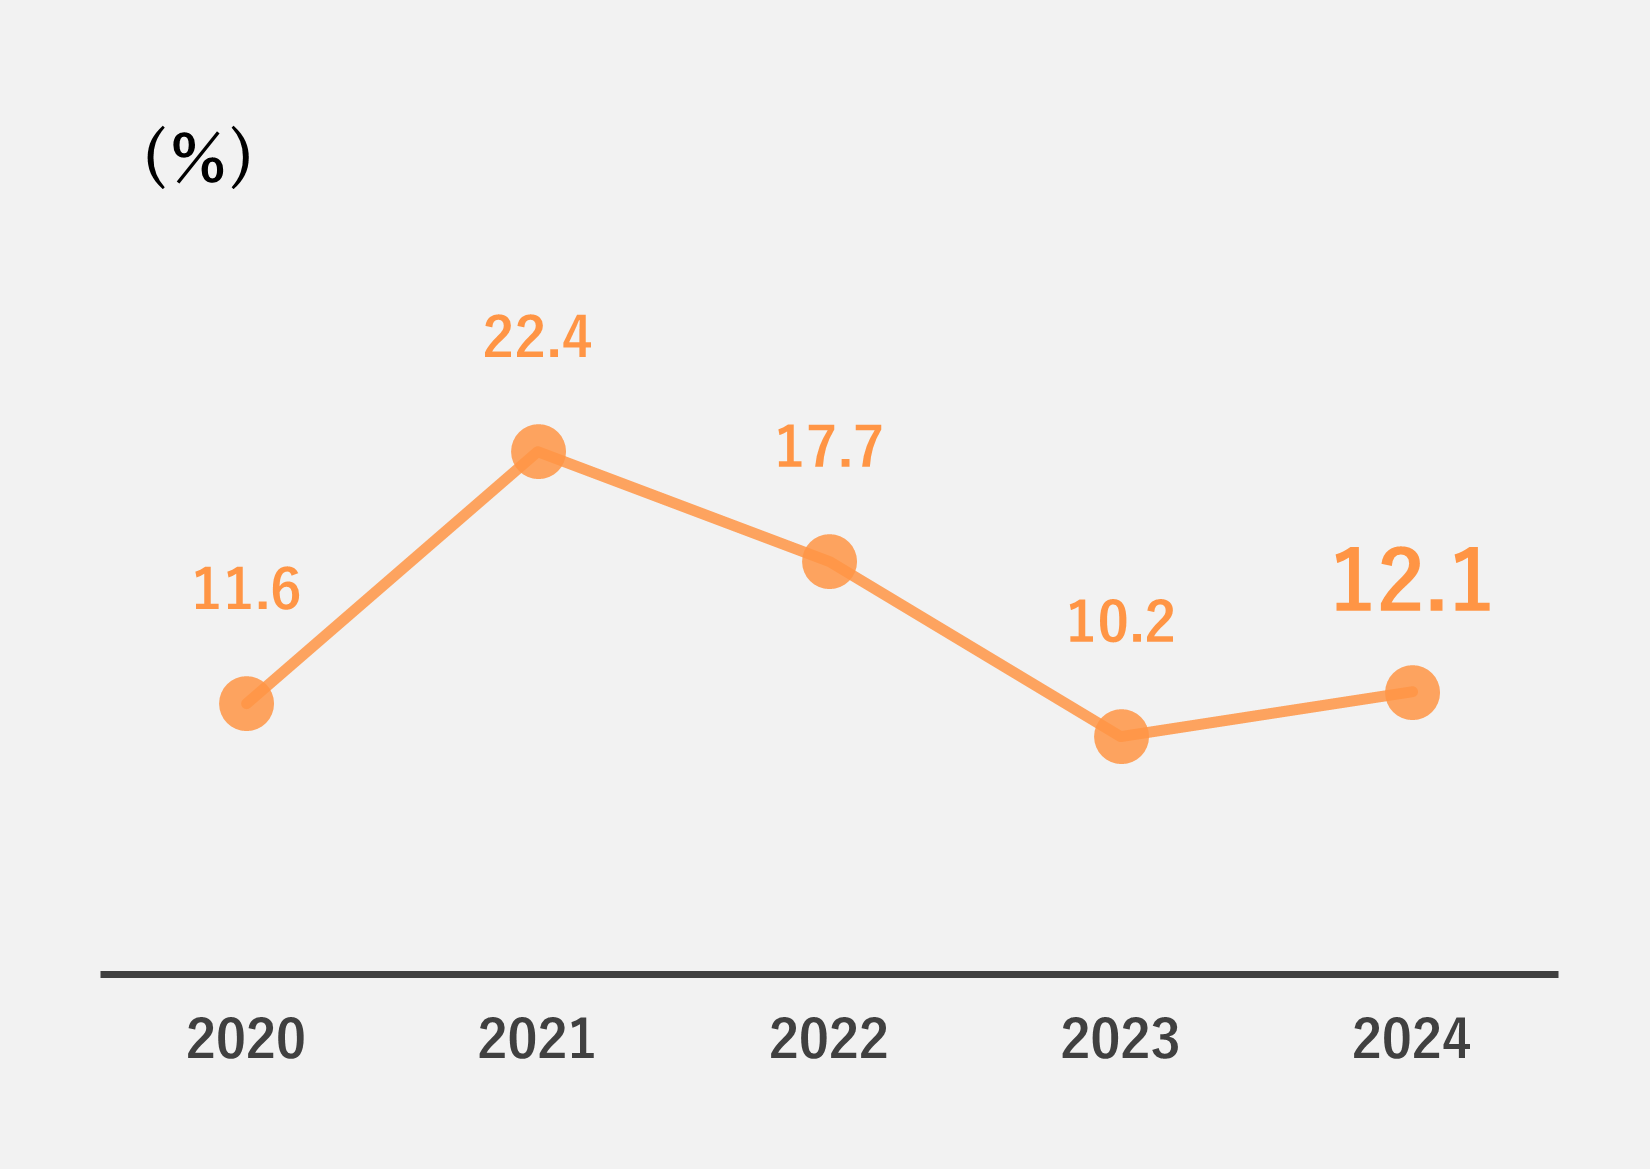
■ROIC(Return on Invested Capital)
| 2022 | 2023 | 2024 | ||||
| Net sales (1,000 yen) |
4,824,795 | 4,536,499 | 4,931,476 | |||
| Operating profit (1,000 yen) |
609,728 | 472,160 | 473,480 | |||
| Ordinary profit (1,000 yen) |
715,537 | 530,844 | 557,890 | |||
| Profit attributable to owners of parent (1,000 yen) |
531,242 | 308,345 | 423,184 | |||
| Comprehensive income (1,000 yen) |
563,637 | 312,085 | 479,079 | |||
| Net assets (1,000 yen) |
2,001,050 | 2,266,204 | 2,733,759 | |||
| Total assets (1,000 yen) |
4,824,280 | 6,175,708 | 6,594,824 | |||
| Net assets per share (Yen) *3 |
113.69 | 128.77 | 152.01 | |||
| Profit per share (Yen)*3 |
30.29 | 17.57 | 24.11 | |||
| Operating profit margin (%) |
12.6 | 10.4 | 9.6 | |||
| Equity capital ratio (%) |
41.4 | 36.6 | 40.5 | |||
| Net cash provided by operating activities (1,000 yen) |
585,083 | 725,473 | 474,644 | |||
| Net cash provided by (used in) investing activities (1,000 yen) |
(69,841) | (441,033) | (514,486) | |||
| Net cash provided by (used in) financing activities (1,000 yen) |
(142,166) | 754,430 | (108,993) | |||
| Ending balance of cash and cash equivalents (1,000 yen) |
1,779,633 | 2,829,579 | 2,729,355 |
*3)
The Company carried out a 3-for-1 stock split of its common shares as of October 1, 2022. Under the assumption that such stock split was implemented at the beginning of the fiscal year 2022, the Company calculates "earnings per share" and "diluted earnings per share."
For more detailed earnings information, please refer to the links below.
■Quarterly Financial Statements(https://en.amita-hd.co.jp/ir/result.html)
Notices
■Data provided in this section is compiled from the Company's quarterly earnings announcements. For more detailed earnings information, refer to the Company's quarterly earnings announcements and financial reports.
■In compiling data provided in this section, we have made every effort to ensure its accuracy. Despite our best efforts, data may not be entirely accurate for internal or external reasons beyond our control.
■This section may not be updated immediately after corrections are made to published earnings announcements.
(Next update on this section is scheduled for March, 2026.)


